
could not resize shared memory segment means a parallel query ran out of /dev/shm, which Docker sets to 64 MB.
It failed one hash join at work_mem=16MB, and three at once at the default 4MB.
shared_buffers didn't use /dev/shm in my tests, so size shm_size for parallel queries and budget memory separately.
I ran this on PostgreSQL 18.6 with Docker 29.6.1 and 29.9.3 on cgroup v2 under WSL2, using orders, a 6M row table, and shuffled 3M row tables.
Container memory limits stood in for a small server, so none of this ran on a real VPS, with real swap, or with a host-level OOM.
The queries are constructed worst cases, not an application's workload.
What Does 64 MB of /dev/shm Fail On?
This is the error a client sees:
ERROR:  could not resize shared memory segment "/PostgreSQL.2004635166" to 16777216 bytes: No space left on device
CONTEXT:  parallel worker
A parallel hash join builds one hash table that all its workers share, so Postgres puts it in dynamic shared memory.
On my containers those segments were files in /dev/shm, and the join failed the moment they needed more than the 64 MB Docker gives it.
The server stayed up, and the error arrived within seconds.
I ran a 6M row self-join at each setting, and all 3 runs per cell agreed.
Each cell shows the peak size of /dev/shm:
| work_mem | 0 workers | 1 worker | 2 workers (default) | 4 workers |
|---|---|---|---|---|
| 4MB (default) | 1 MB | 15 MB | 23 MB | 31 MB |
| 8MB | 1 MB | 25-33 MB | 50 MB | Fails |
| 16MB | 1 MB | 54 MB | Fails | Fails |
| 32MB | 1 MB | Fails | Fails | Fails |
One query at default settings fit, including on a 30M row table and a four-table join with three parallel hashes, which peaked at 31 MB. That peak isn't three times 23 MB, so there's no per-join formula to print.
Queries that pass alone fail together, and that includes the defaults:
| Concurrent queries | Errors per run, work_mem=8MB | Errors per run, default 4MB |
|---|---|---|
| 1 | 0, 0, 0 | 0, 0, 0 |
| 2 | 2, 1, 2 | 0, 0, 0 |
| 3 | Not run | 1, 1, 2 |
| 4 | 3, 4, 3 | 1, 2, 2 |
| 8 | 5, 7, 5 | 3, 3, 3 |
The tables have to be large enough for a parallel hash to fill it, and I can't say how often a real schema gets there.
To reproduce it, use a scratch container, never a server you care about.
These lines create a 6M row table and self-join it, and on a real orders table the joins could run for a long time:
docker exec postgres psql -U postgres -d shop -c "CREATE TABLE orders AS SELECT g AS id, (g % 1000)::int AS customer_id, md5(g::text) AS note FROM generate_series(1,6000000) g;"
docker exec postgres psql -U postgres -d shop -c 'ANALYZE orders;'
docker exec postgres psql -U postgres -d shop -c "SET work_mem = '16MB';" -c 'SELECT count(*) FROM orders a JOIN orders b ON a.id = b.id;'
Does shm_size Need to Match shared_buffers?
No, and any advice that it must be at least shared_buffers didn't hold in my tests.
shared_buffers and parallel query memory are different regions, and two settings show that:
docker exec postgres psql -U postgres -d shop -c 'SHOW shared_memory_type;'
docker exec postgres psql -U postgres -d shop -c 'SHOW dynamic_shared_memory_type;'
docker exec postgres df -h /dev/shm
Mine printed mmap and posix.
The Postgres docs (read November 7, 2026) say shared_memory_type covers the main region with the buffers, anonymous mmap by default on Linux, while posix is the dynamic setting that uses shm_open.
They never name /dev/shm, so I tested the link directly.
I gave a container shared_buffers=512MB and a 2 MB /dev/shm, loaded 440 MB into the pool, then ran a parallel hash on it:
shm             2.0M  1.1M  992K  52% /dev/shm
shared_memory_size=558MB
buffers_in_use_MB=440
1056	/dev/shm
ERROR:  could not resize shared memory segment "/PostgreSQL.1672976228" to 1048576 bytes: No space left on device
440 MB of buffers sat in use while /dev/shm stayed at 1,056 KB, and the hash failed 3 of 3.
How Do You Set shm_size in Docker Compose?
Add one line to the service, because Docker's default (read November 7, 2026) is 64 MB when shm_size is left out:
services:
  postgres:
    image: postgres:18
    shm_size: 256mb
    container_name: postgres
    environment:
      POSTGRES_PASSWORD: labpass
      POSTGRES_DB: shop
    volumes:
      - pgdata:/var/lib/postgresql
volumes:
  pgdata:
labpass is my throwaway lab password, so set your own.
docker compose up -d --wait recreated the container with it, which restarts Postgres and drops its connections.
The first value this prints is 268435456:
docker inspect --format '{{.HostConfig.ShmSize}} {{.HostConfig.Memory}} {{.HostConfig.MemorySwap}}' postgres
The query that failed at work_mem=16MB returned 6000000 with it, and work_mem=32MB passed 3 of 3 with a peak of 143,840 KB.
Don't size it to the memory limit, because /dev/shm counts against that limit.
With --memory 1g --shm-size 1g and work_mem=256MB, the kernel killed a backend 3 of 3, so a clean error for one query became a dropped connection for every client.
How Do Docker's Memory Limit and work_mem Interact?
mem_limit sets a cgroup limit, and past it the kernel kills a process in the container.
The usual sum is shared_buffers plus connections times work_mem times hash_mem_multiplier, and it runs low for two reasons.
First, work_mem isn't a ceiling on a backend's memory.
I measured peak private memory per backend, with hash_mem_multiplier at its default of 2, 3 runs per cell:
| Operation | work_mem | Budget | Postgres memory contexts | Peak RssAnon |
|---|---|---|---|---|
| Hash aggregate, text | 4MB | 8 MB | 10 MB | 34 MB |
| Hash aggregate, text | 64MB | 128 MB | 145 MB | 169 MB (201 in 1 of 3) |
| Sort, text | 4MB | 4 MB | 13 MB | 36 MB |
| Sort, text | 64MB | 64 MB | 177 MB | 199 MB |
Apart from that 201 MB run, every cell ran about 22 to 27 MB above Postgres's own count, whatever work_mem was, and I can't say what that gap is.
So budget each busy backend at its limit plus about 25 MB, and allow about 3 times work_mem for sorts of long text.
Second, connections cost more than the sum says, so equal sums behave differently. These are all connections hashing at once with no swap, 3 of 3 per row:
| Limit | shared_buffers | work_mem | Connections | Sum | Result |
|---|---|---|---|---|---|
| 1 GB | 256MB | 64MB | 4 | 768 MB | OK |
| 1 GB | 256MB | 32MB | 8 | 768 MB | OOM |
| 2 GB | 512MB | 64MB | 8 | 1536 MB | OK |
| 2 GB | 512MB | 32MB | 16 | 1536 MB | OOM |
At 16 connections and about 100 MB each, plus 512 MB of buffers, the total passes 2 GB, while 8 at about 170 MB doesn't. That's my arithmetic, and it fits the fixed gap above.
A full limit alone means little, because page cache fills it and the kernel reclaims that.
Scanning 1,954 MB under a 1 GB limit read memory.current at 1,023 MB with no kill, while docker stats showed 66 MiB, because it subtracts inactive cache.
Compare the two yourself (these paths assume cgroup v2):
docker stats --no-stream postgres
docker exec postgres cat /sys/fs/cgroup/memory.current
docker exec postgres cat /sys/fs/cgroup/memory.max
docker exec postgres grep -E '^(anon|file|shmem|inactive_file) ' /sys/fs/cgroup/memory.stat
The kernel charges shared_buffers when pages are touched, not at start.
A 768 MB pool under a 1 GB limit read 52 MB fresh and 1,023 MB once warmed, so an oversized value starts cleanly and shows up only under load.
What Does an OOM Kill Look Like?
In my runs the container stayed up, and one kill dropped every connection:
LOG:  client backend (PID 148) was terminated by signal 9: Killed
DETAIL:  Failed process was running: SELECT count(*) FROM (SELECT note FROM orders GROUP BY note) s
LOG:  terminating any other active server processes
LOG:  all server processes terminated; reinitializing
OOMKilled=true status=running exit=0 restarts=0
oom_kill 1
oom_group_kill 0
Other sessions saw terminating connection because of crash of another server process.
Postgres reinitialized inside the same container, so StartedAt and pg_postmaster_start_time() didn't change.
The victim isn't always the big backend, and one run lost an io worker.
The postmaster was never the victim in my runs, so I can't say what that looks like.
A non-Postgres PID 1 killed this way exited 137.
These checks only read:
docker inspect --format '{{.State.Status}} OOMKilled={{.State.OOMKilled}} exit={{.State.ExitCode}} restarts={{.RestartCount}}' postgres
docker exec postgres cat /sys/fs/cgroup/memory.events
docker logs postgres 2>&1 | grep -E 'terminated by signal 9|terminating any other|all server processes' | tail -3
timeout 5 docker events --since 10m --filter container=postgres --filter event=oom --format '{{.Action}}'
timeout 5 exits 124 once the time is up, which is normal, and without it docker events never returns.
The Docker API spec (read November 7, 2026) says OOMKilled covers any process in the container since it last started, so it isn't a Postgres-specific flag.
It stayed true while the server was serving queries, and only docker restart or docker compose restart postgres cleared it.
oom_kill in memory.events is the per-container count.
dmesg reports the whole kernel, and in one run it showed another container's kill while this one read oom_kill 0.
What Memory Settings Should You Start With on a 2 GB VPS?
Start by not giving Postgres the whole server, because a real 2 GB VPS also runs the OS, Docker, and usually the app.
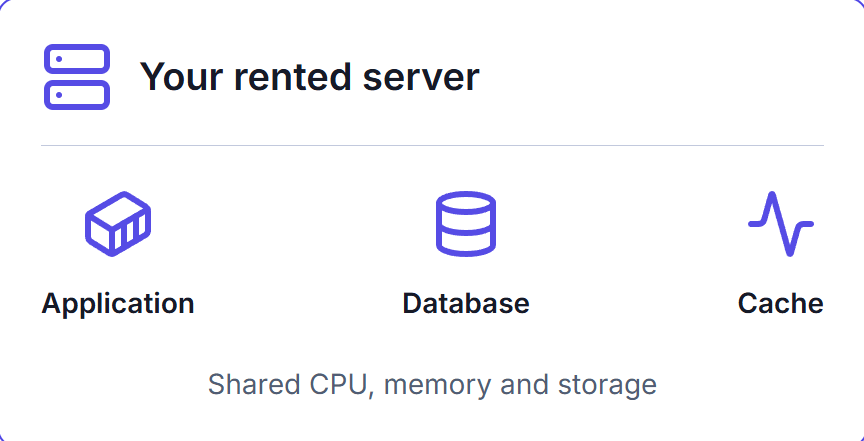
A limit equal to the VPS's RAM protects nothing, because the kernel can then pick any process on the host, which I couldn't test here.
So this file uses 1536m as a stand-in for what's left, with memswap_limit matching it so the container gets no swap.
I didn't measure that number on a VPS, and an app on the same server means less again.
services:
  postgres:
    image: postgres:18
    container_name: postgres
    restart: unless-stopped
    mem_limit: 1536m
    memswap_limit: 1536m
    shm_size: 256mb
    environment:
      POSTGRES_PASSWORD: labpass
      POSTGRES_DB: shop
    command:
      - postgres
      - -c
      - shared_buffers=384MB
      - -c
      - work_mem=4MB
      - -c
      - max_connections=20
      - -c
      - maintenance_work_mem=64MB
      - -c
      - effective_cache_size=1GB
    volumes:
      - pgdata:/var/lib/postgresql
volumes:
  pgdata:
Copy mem_limit, memswap_limit, shm_size, and command into your service, and keep your own image, password, and volumes lines.
These are starting values for a container with that limit, and they aren't best practice.
My first set was shared_buffers=512MB, work_mem=8MB, 30 connections, and maintenance_work_mem=128MB, with a full 2 GB to the container:
| Limit | Values | Load | Result, 3 runs each |
|---|---|---|---|
| 2 GB | First set | 30 hash aggregates, or 30 sorts | OK |
| 2 GB | First set | 29 hash aggregates plus CREATE INDEX | OOM 1 of 3 |
| 1,536 MB | First set | 30 hash aggregates, or 30 sorts | OOM 3 of 3 each |
| 1,536 MB | File above | 20 hash aggregates, or 20 sorts | OK |
| 1,536 MB | File above | 19 hash aggregates or sorts plus CREATE INDEX | OK |
| 1,536 MB | File above | 20 parallel aggregates, or 4 parallel hash joins | OK |
The file above passed all 18 runs, with sorts on 2M of the 6M rows to limit temp disk use. I didn't search for its ceiling, so its margin is unknown and could be thin.
The first set shows how fast the margin goes, passing at 2 GB most of the time and failing 6 of 6 once the limit dropped by 512 MB. If an app shares the server, lower the limit and scale these down from there.
max_connections=20 will refuse an app pool larger than that, which is a judgment call for your app, and the docs (read November 7, 2026) suggest a connection pooler when connections are the pressure.
shared_buffers=384MB is a quarter of the limit, in line with the docs' 25 percent starting value for a dedicated server.
I can't give you a best value.
My pgbench runs couldn't separate the settings from noise, and a WSL2 virtual disk with host caching isn't comparable to a VPS disk, where the result may change.
Summary
could not resize shared memory segment is /dev/shm running out under a parallel query.
It failed one hash join at work_mem=16MB and three at once at the default 4MB, and shm_size: 256mb fixed the failures I retested.
shared_buffers stayed out of it, because a 512 MB pool held 440 MB with /dev/shm at 2 MB.
Under a memory limit, the usual sum runs low.
Each busy backend used about 25 MB above its budget, text sorts reached about 3 times work_mem, and one kill dropped every connection while the container stayed up with OOMKilled=true.
The values above survived my worst cases at 1,536 MB, with a margin I didn't measure, on no real VPS.
Start there, watch memory.events, and go lower when the app shares the server.
My self-hosting course deploys a .NET API with PostgreSQL and Redis on one server and builds a monthly maintenance routine that covers server resources.
Thanks for reading.
And stay awesome!
Frequently Asked Questions
What causes could not resize shared memory segment in Docker?
A parallel query ran out of /dev/shm, which Docker sets to 64 MB by default. The query fails with that error and the server stays up. Setting shm_size to 256 MB in Compose fixed it in every run, at work_mem values that failed on 64 MB.
Does shm_size need to match shared_buffers?
No. A 512 MB buffer pool with 440 MB in use left /dev/shm at 1,056 KB, with /dev/shm capped at 2 MB. On Linux the buffer pool uses anonymous mmap. Beyond about 1 MB there from startup, only parallel query memory went into /dev/shm in testing.
Is 64 MB of /dev/shm enough for Postgres?
For one query at default settings, it was in testing. Three parallel hash joins at once failed at the default work_mem, and one failed at work_mem of 16 MB. Set shm_size higher, and remember that what it holds counts against the memory limit.
How do I tell if Postgres was OOM killed in Docker?
Look for terminated by signal 9 in the Postgres log and a raised oom_kill count in the memory.events file of the container cgroup. In my runs the container kept running with exit 0, and the OOMKilled flag stays true until the container restarts. It covers any process in the container.
What Postgres memory settings should I start with on a 2 GB VPS?
I started from a 1,536 MB container limit, 384 MB of shared_buffers, 4 MB of work_mem, and 20 connections, which survived constructed worst cases in a lab. These are not best practice, and they were not measured on a VPS. An app on the same server means less memory again.
