
Postgres can choose a slower plan after you add an index, because the planner gains another execution path and can misjudge its cost.
Here, an index on created_at DESC looked cheap for an ORDER BY ... LIMIT 10 query, but its scan discarded 495,944 rows and the query went from 16.5ms to 241ms.
A composite index on (user_id, created_at DESC) fixes it in 0.067ms.
By now, we've all seen examples of AI models being wrong in ways that make it seem like they're right. And the problem isn't that the model isn't good enough or "smart" enough. It's that you need the right harness governing the model. Building an agent harness that survives production delivers a complete architectural overview in just 13 minutes - read the full breakdown.
Ship enterprise-grade analytical features faster and at a fraction of the cost. Tinybird manages ClickHouse infrastructure, ingestion, API publishing, authentication, and dev tooling so you can focus on building real-time features, fast. Try it today.
Adding an index can make an existing query slower.
That sounds backwards, so I want to show you a small Postgres experiment. The query stays the same throughout. Only the available indexes change.
The Setup
The table contains one million comments with id, user_id, body, and created_at columns.
User 42 owns 10,000 comments, all between 12 and 14 months old.
Everyone else's comments are spread across the last two years.
I used this SQL to seed the data:
CREATE TABLE comments (
    id INT GENERATED ALWAYS AS IDENTITY PRIMARY KEY,
    user_id INT NOT NULL,
    body TEXT NOT NULL,
    created_at TIMESTAMPTZ NOT NULL
);

SELECT setseed(0.212);
INSERT INTO comments (user_id, body, created_at)
SELECT 1 + (g % 100),
       'Comment body ' || g,
       CASE WHEN 1 + (g % 100) = 42
            THEN TIMESTAMPTZ '2026-09-01' - INTERVAL '14 months'
                 + random() * INTERVAL '2 months'
            ELSE TIMESTAMPTZ '2026-09-01' - random() * INTERVAL '2 years'
       END
FROM generate_series(1, 1000000) AS g;

CREATE INDEX ix_comments_user_id ON comments (user_id);
VACUUM ANALYZE comments;
Think of a user who stopped posting a year ago. Their profile still needs to show their latest ten comments:
SELECT *
FROM comments
WHERE user_id = 42
ORDER BY created_at DESC
LIMIT 10;
I measured on Postgres 18.6 after VACUUM ANALYZE, quoting the second run of each query.
Your timings will differ.
Add One Index
Initially, an index on user_id finds the user's comments.
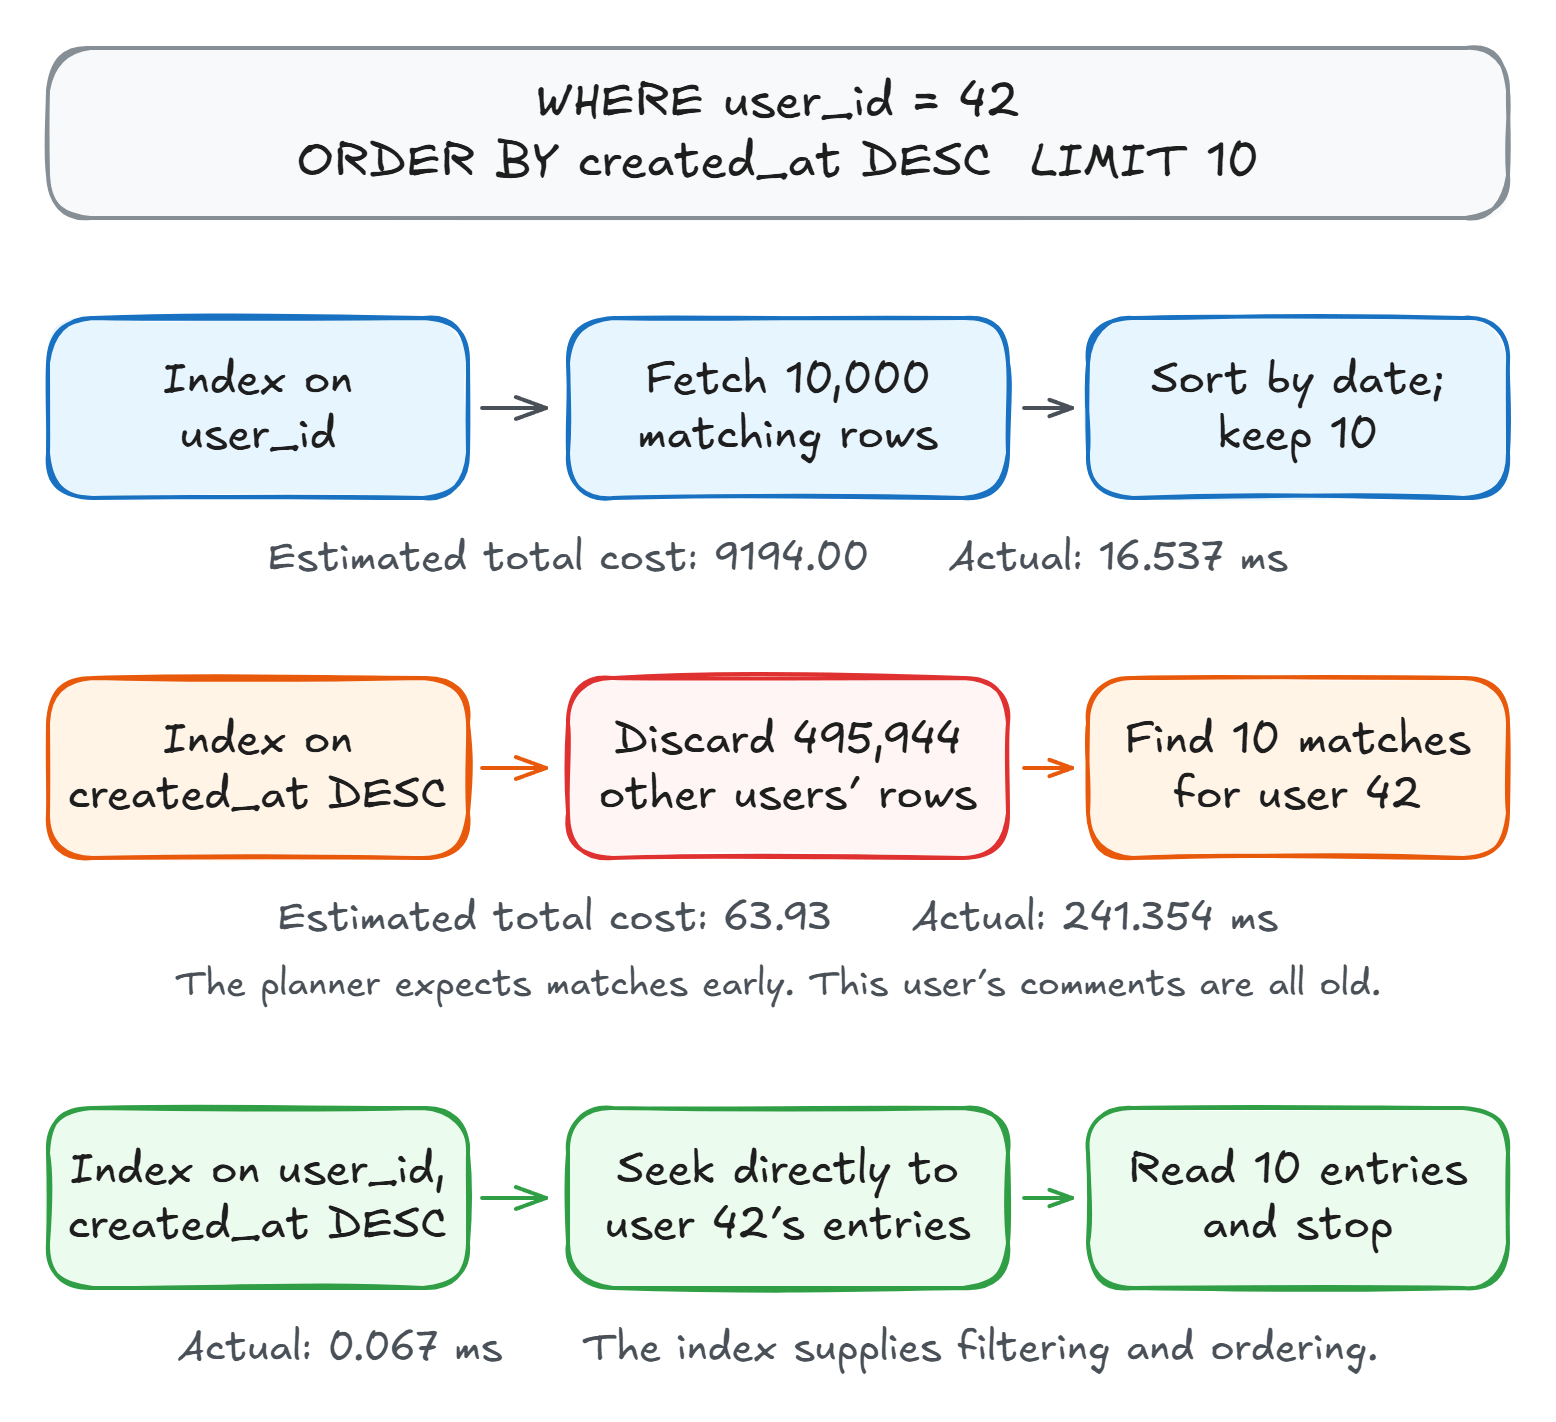
Postgres fetches all 10,000, sorts by date, and keeps ten.
The relevant lines from EXPLAIN ANALYZE, which executes the query and reports the work performed:
Limit
  -> Sort
       -> Bitmap Heap Scan on comments (rows=10000.00 loops=1)
            -> Bitmap Index Scan on ix_comments_user_id
Execution Time: 16.537 ms
Now add an index that could serve a separate screen listing recent comments:
CREATE INDEX ix_comments_created_at
ON comments (created_at DESC);
Run the profile query again:
Limit
  -> Index Scan using ix_comments_created_at on comments
       Filter: (user_id = 42)
       Rows Removed by Filter: 495944
Execution Time: 241.354 ms
The query went from 16.5ms to 241ms. It now walks comments newest-first, fetching and discarding almost half a million rows before finding ten that belong to user 42.
Why That Plan Looked Cheap
The planner estimates the cost of each available execution path.
An index matching ORDER BY with LIMIT is attractive because it can stop as soon as it finds enough matching rows.
User 42 owns roughly 1% of the table. If their comments were evenly spread through the date index, finding ten would take about a thousand entries. That looks cheaper than fetching and sorting 10,000 rows.
But this user's comments are all old. The planner's estimate doesn't capture where those matches occur in the date ordering.
You can see the bet in the top Limit node's estimated total cost: 9194.00 for the original plan, versus 63.93 for the date-index plan.
These are planner cost units, not milliseconds.
Postgres expects the limit to stop the second plan early, even though scanning that entire index would be expensive.
The estimated number of matching comments was 9,733, close to the actual 10,000. The mistake wasn't primarily how many comments belonged to this user. It was how far the scan would travel before reaching them.
Stale statistics can cause bad plans, but I ran VACUUM ANALYZE right after seeding, so the statistics here are fresh.
Running ANALYZE again doesn't teach ordinary per-column statistics this relationship.
Give the Query an Index That Fits
Put the equality condition first and the sort column second:
CREATE INDEX ix_comments_user_date
ON comments (user_id, created_at DESC);
This index locates user 42's section, where comments are already newest-first:
Limit
  -> Index Scan using ix_comments_user_date on comments
       Index Cond: (user_id = 42)
Execution Time: 0.067 ms
Postgres reads ten entries and stops.
The tradeoff is another index to store and maintain on writes.
The new composite may also make the old user_id index redundant, but check its other queries and dependencies before dropping it.
I cover the column-order reasoning in how to design the right SQL index.
Summary
Adding ix_comments_created_at gave the planner a cheaper-looking path for this query, and the estimate was wrong about how far that path would travel.
The composite index on (user_id, created_at DESC) fixed it because it supplies both the filter and the ordering.
When adding an index, compare the plans of your important queries before and after. Use the same parameters for each comparison, then repeat with representative values: an active user and someone who hasn't posted recently, for example. Testing only your most active account could hide this regression.
Run EXPLAIN (ANALYZE, BUFFERS) and follow the work underneath Limit.
Here, the date-index plan reported 497,260 shared-buffer hits, compared with 8,344 originally.
Those are buffer accesses, including repeated accesses to a page, rather than a count of unique pages.
They explain why a warm cache didn't rescue this plan.
I would investigate a large Rows Removed by Filter count before changing planner settings.
The index regression lab has the seed script, the Docker commands, and my full captured output.
If you want to apply this to filtering and pagination in a complete application, I build those endpoints in Pragmatic REST APIs.
Thanks for reading.
And stay awesome!
Frequently Asked Questions
Why can adding an index make a Postgres query slower?
The new index gives the planner another execution path. For ORDER BY with LIMIT, an index in the requested order can look cheap because Postgres expects to find enough matching rows early. If those matches occur far into the index, filtering them can cost more than fetching and sorting through another index.
How do you fix an index scan with many rows removed by filter?
Inspect the filter and ordering together. In this example, an index on (user_id, created_at DESC) locates the requested user and reads that user’s newest comments in order, so LIMIT 10 stops after ten entries.
Will ANALYZE always fix a bad query plan?
No. Stale statistics can cause bad estimates, so check them. But the statistics in this example were fresh from VACUUM ANALYZE. The missing information is where a particular user’s comments occur in date order, which ordinary per-column statistics do not describe.


