
OpenTelemetry is the vendor-neutral standard for collecting traces, metrics, and logs: you instrument once and export to any backend over OTLP.
In .NET, a few NuGet packages and one AddOpenTelemetry() call in Program.cs get every request traced end to end, with metrics and logs correlated to it.
A request hits your API, fans out to two downstream services, and fails somewhere in the middle. Without distributed tracing, finding out where means grepping logs on three machines and matching timestamps by hand. Here's how to set it up in .NET, from the first NuGet package to a production-shaped collector pipeline.
What Is OpenTelemetry?
OpenTelemetry (OTel) is a vendor-neutral standard for collecting traces, metrics, and logs from your application. Instead of locking into a specific vendor, you instrument once and export to any backend: Jaeger, Prometheus, Grafana, Datadog, or Azure Monitor.
The three pillars of observability:
- Traces: follow a request across services
- Metrics: count things, measure durations
- Logs: structured diagnostic messages
In .NET, OpenTelemetry's tracing API is the built-in Activity API, and metrics build on System.Diagnostics.Metrics.
You're not bolting on a foreign SDK; you're exporting what the runtime and ASP.NET Core already produce.
Setting Up Tracing
dotnet add package OpenTelemetry.Extensions.Hosting
dotnet add package OpenTelemetry.Instrumentation.AspNetCore
dotnet add package OpenTelemetry.Instrumentation.Http
dotnet add package OpenTelemetry.Instrumentation.SqlClient
dotnet add package OpenTelemetry.Exporter.OpenTelemetryProtocol
Configure in Program.cs:
builder.Services.AddOpenTelemetry()
    .ConfigureResource(resource =>
        resource.AddService(
            serviceName: "orders-api",
            serviceVersion: "1.0.0"))
    .WithTracing(tracing =>
    {
        tracing
            .AddAspNetCoreInstrumentation()
            .AddHttpClientInstrumentation()
            .AddSqlClientInstrumentation(options =>
            {
                options.SetDbStatementForText = true;
                options.RecordException = true;
            })
            .AddOtlpExporter(options =>
            {
                options.Endpoint = new Uri("http://localhost:4317");
            });
    });
This automatically traces:
- Incoming HTTP requests (ASP.NET Core)
- Outgoing HTTP requests (HttpClient)
- Database queries (SqlClient)
Trace context propagates between services automatically via the W3C traceparent header, so a request that crosses three services still shows up as one trace.
For a deeper conceptual walkthrough, see my introduction to distributed tracing.
You can also configure the exporter endpoint without code, using standard environment variables:
OTEL_EXPORTER_OTLP_ENDPOINT=http://localhost:4317
OTEL_SERVICE_NAME=orders-api
The OTLP exporter reads OTEL_EXPORTER_OTLP_ENDPOINT and the SDK's resource builder reads OTEL_SERVICE_NAME, so each container environment can set its own values without code changes.
Values set in code take precedence, so remove the hardcoded endpoints and the AddService call when you rely on these variables.
Viewing Traces in Jaeger
Run Jaeger locally:
docker run -d --name jaeger \
  -p 16686:16686 \
  -p 4317:4317 \
  jaegertracing/all-in-one:latest
Open http://localhost:16686 to see traces.
Each trace follows a request from the API endpoint through HTTP calls to database queries.
For local development, the standalone Aspire dashboard is even faster to run. It is a single container that displays traces, metrics, and logs from any OTLP source, so you don't need Jaeger, Prometheus, or Grafana.
Custom Spans
Spans nest inside a single trace: the top-level operation becomes the root span, and each StartActivity call opens a child span underneath it.
For the naming, lifecycle, and sampling details that make manual instrumentation reliable, see custom spans with ActivitySource.
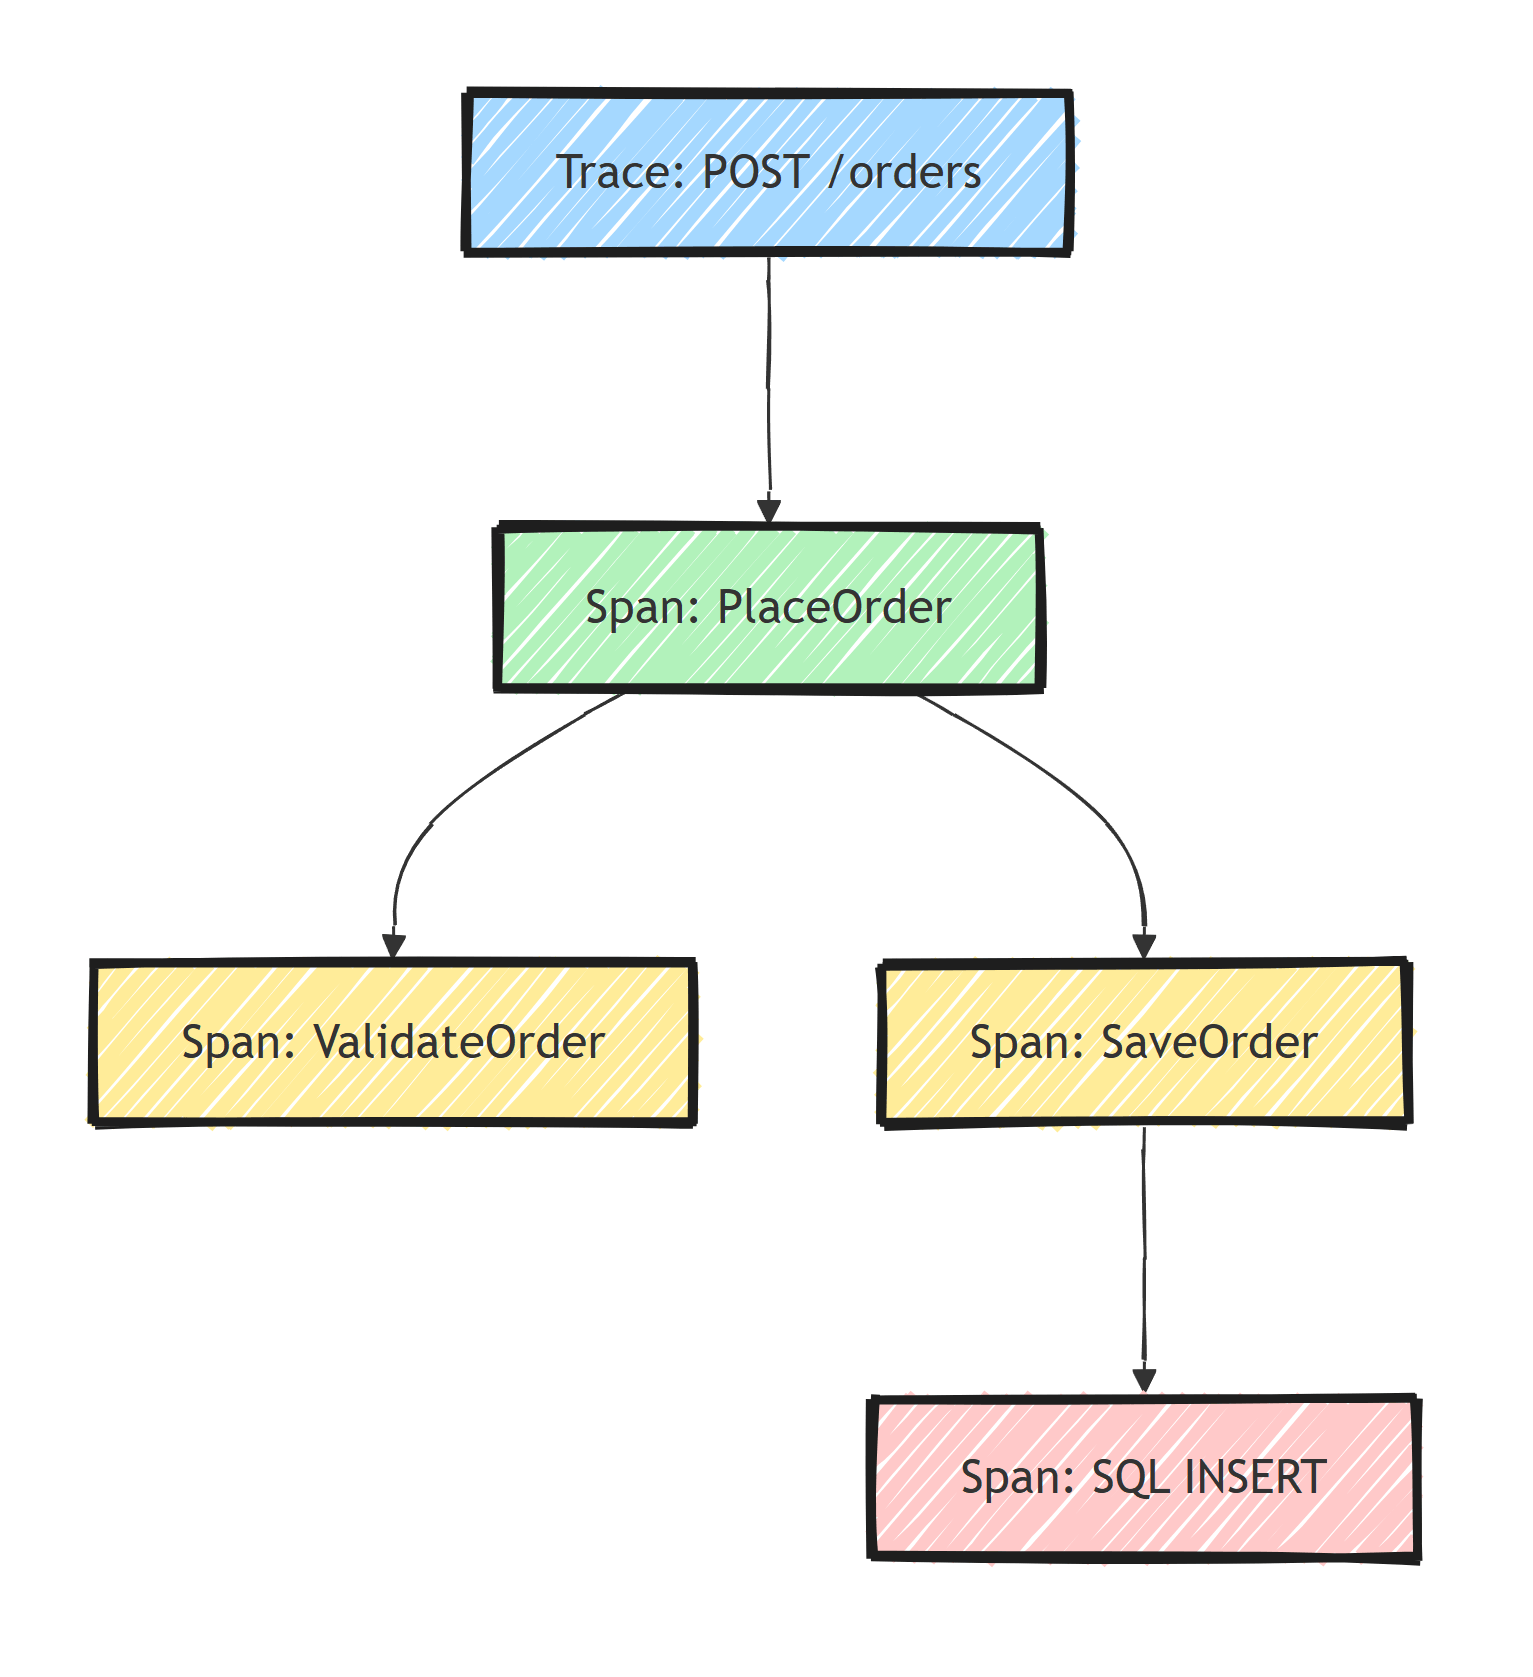
Add custom instrumentation for business operations:
public class OrderService
{
    private static readonly ActivitySource ActivitySource =
        new("OrdersApi.OrderService");

    public async Task<Order> PlaceOrderAsync(PlaceOrderCommand command)
    {
        using var activity = ActivitySource.StartActivity(
            "PlaceOrder",
            ActivityKind.Internal);

        activity?.SetTag("order.customer_id", command.CustomerId);
        activity?.SetTag("order.item_count", command.Items.Count);

        var order = Order.Create(command.CustomerId, command.Items);

        using (var validationActivity = ActivitySource.StartActivity(
            "ValidateOrder"))
        {
            order.Validate();
            validationActivity?.SetTag("order.valid", true);
        }

        using (var dbActivity = ActivitySource.StartActivity(
            "SaveOrder"))
        {
            _db.Orders.Add(order);
            await _db.SaveChangesAsync();
            dbActivity?.SetTag("order.id", order.Id);
        }

        activity?.SetTag("order.id", order.Id);
        activity?.SetTag("order.total", order.TotalAmount);

        return order;
    }
}
Register the custom activity source.
AddOpenTelemetry() calls are additive, so this extends the tracing setup from earlier:
builder.Services.AddOpenTelemetry()
    .WithTracing(tracing => tracing.AddSource("OrdersApi.OrderService"));
Setting Up Metrics
dotnet add package OpenTelemetry.Instrumentation.Runtime
dotnet add package OpenTelemetry.Instrumentation.Process
builder.Services.AddOpenTelemetry()
    .WithMetrics(metrics =>
    {
        metrics
            .AddAspNetCoreInstrumentation()
            .AddHttpClientInstrumentation()
            .AddRuntimeInstrumentation()
            .AddProcessInstrumentation()
            .AddOtlpExporter(options =>
            {
                options.Endpoint = new Uri("http://localhost:4317");
            });
    });
Built-in metrics include request duration, request count, active connections, GC collections, and thread pool size.
Custom Metrics
I cover metrics in much more depth (types, cardinality, histogram buckets) in application metrics with OpenTelemetry. Here's a minimal custom meter:
public class OrderMetrics
{
    private readonly Counter<long> _ordersPlaced;
    private readonly Counter<long> _ordersCancelled;
    private readonly Histogram<double> _orderProcessingDuration;
    private readonly UpDownCounter<long> _activeOrders;

    public OrderMetrics(IMeterFactory meterFactory)
    {
        var meter = meterFactory.Create("OrdersApi");

        _ordersPlaced = meter.CreateCounter<long>(
            "orders.placed",
            description: "Total number of orders placed");

        _ordersCancelled = meter.CreateCounter<long>(
            "orders.cancelled",
            description: "Total number of orders cancelled");

        _orderProcessingDuration = meter.CreateHistogram<double>(
            "orders.processing.duration",
            unit: "ms",
            description: "Order processing duration in milliseconds");

        _activeOrders = meter.CreateUpDownCounter<long>(
            "orders.active",
            description: "Number of active (non-completed) orders");
    }

    public void OrderPlaced(decimal amount)
    {
        _ordersPlaced.Add(1,
            new KeyValuePair<string, object?>("currency", "USD"));
        _activeOrders.Add(1);
    }

    public void OrderCancelled()
    {
        _ordersCancelled.Add(1);
        _activeOrders.Add(-1);
    }

    public void RecordProcessingDuration(double milliseconds)
    {
        _orderProcessingDuration.Record(milliseconds);
    }
}
Register and use:
builder.Services.AddSingleton<OrderMetrics>();

builder.Services.AddOpenTelemetry()
    .WithMetrics(metrics => metrics.AddMeter("OrdersApi"));
Structured Logging With OpenTelemetry
builder.Logging.AddOpenTelemetry(options =>
{
    options.IncludeScopes = true;
    options.IncludeFormattedMessage = true;
    options.AddOtlpExporter(otlp =>
    {
        otlp.Endpoint = new Uri("http://localhost:4317");
    });
});
Logs are automatically correlated with traces through the trace ID:
_logger.LogInformation(
    "Order {OrderId} placed by customer {CustomerId} for {Amount}",
    order.Id,
    order.CustomerId,
    order.TotalAmount);
The log entry includes the trace ID, so you can find all logs for a specific request.
Enriching Spans
Add contextual information to spans:
// Middleware to enrich all spans
public class TelemetryEnrichmentMiddleware
{
    private readonly RequestDelegate _next;

    public TelemetryEnrichmentMiddleware(RequestDelegate next)
    {
        _next = next;
    }

    public async Task InvokeAsync(HttpContext context)
    {
        var activity = Activity.Current;

        activity?.SetTag("user.id",
            context.User.FindFirstValue(ClaimTypes.NameIdentifier));
        activity?.SetTag("tenant.id",
            context.Request.Headers["X-Tenant-Id"].FirstOrDefault());

        await _next(context);

        activity?.SetTag("http.response.status_code",
            context.Response.StatusCode);
    }
}
Error Recording
try
{
    await ProcessOrderAsync(command);
}
catch (Exception ex)
{
    Activity.Current?.SetStatus(ActivityStatusCode.Error, ex.Message);
    Activity.Current?.AddException(ex);
    throw;
}
Errors appear in Jaeger as red spans with the full exception details.
AddException is built into .NET 9; on older targets, use the RecordException extension method from the OpenTelemetry API package.
Sampling
Tracing every request is fine in development and often too expensive in production. Sampling keeps a representative fraction:
builder.Services.AddOpenTelemetry()
    .WithTracing(tracing =>
        tracing.SetSampler(
            new ParentBasedSampler(
                new TraceIdRatioBasedSampler(0.10)))); // keep 10%
ParentBasedSampler respects the sampling decision of the calling service, so when every service uses it, a trace is either captured across all services or not at all.
Without it, each service makes its own decision, so a service with a different ratio or sampler (or another language's SDK) leaves trace fragments with spans missing.
Start at 100% while traffic is low, and dial down as volume grows. Errors are rare and valuable, so if your backend supports tail-based sampling (deciding after the trace completes), prefer keeping all error traces.
Docker Compose for the Full Stack
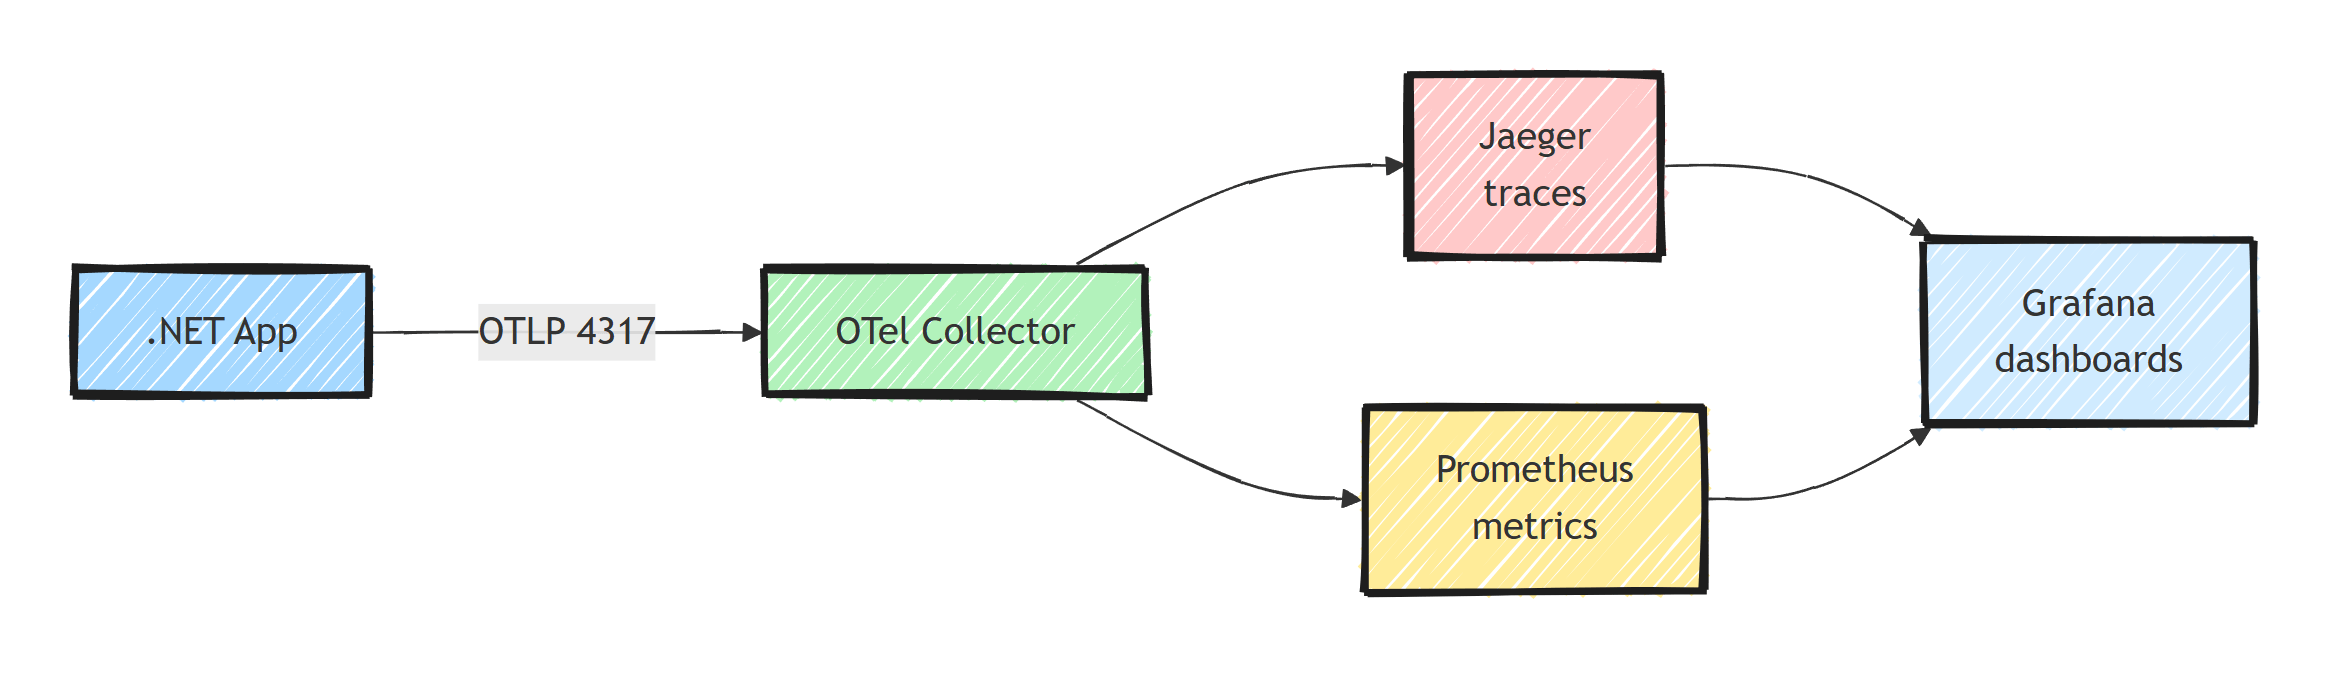
The application sends everything to the collector on port 4317, and the collector fans out to Jaeger and exposes metrics for Prometheus to scrape:
services:
  jaeger:
    image: jaegertracing/all-in-one:latest
    ports:
      - "16686:16686" # UI

  prometheus:
    image: prom/prometheus:latest
    ports:
      - "9090:9090"
    volumes:
      - ./prometheus.yml:/etc/prometheus/prometheus.yml

  grafana:
    image: grafana/grafana:latest
    ports:
      - "3000:3000"

  otel-collector:
    image: otel/opentelemetry-collector-contrib:latest
    ports:
      - "4317:4317" # OTLP gRPC (your app points here)
    volumes:
      - ./otel-collector-config.yaml:/etc/otel-collector-config.yaml
    command: ["--config=/etc/otel-collector-config.yaml"]
The compose file mounts two configs.
Here's otel-collector-config.yaml, which receives OTLP from your app and fans out traces to Jaeger and metrics to a Prometheus endpoint:
receivers:
  otlp:
    protocols:
      grpc:
        endpoint: 0.0.0.0:4317

exporters:
  otlp/jaeger:
    endpoint: jaeger:4317
    tls:
      insecure: true
  prometheus:
    endpoint: 0.0.0.0:8889

service:
  pipelines:
    traces:
      receivers: [otlp]
      exporters: [otlp/jaeger]
    metrics:
      receivers: [otlp]
      exporters: [prometheus]
And prometheus.yml, which scrapes the metrics the collector exposes on port 8889:
scrape_configs:
  - job_name: 'otel-collector'
    scrape_interval: 15s
    static_configs:
      - targets: ['otel-collector:8889']
Only the collector publishes port 4317 to the host; it forwards traces to Jaeger over the internal Docker network, and Prometheus scrapes it internally too. This is the production-shaped setup: your app only ever knows about one OTLP endpoint, and you reconfigure backends in the collector.
For wiring the Grafana dashboards on top of this stack, see monitoring .NET applications with OpenTelemetry and Grafana.
Summary
OpenTelemetry in .NET:
- Traces: automatic instrumentation for ASP.NET Core, HttpClient, and SQL
- Custom spans: use
ActivitySourcefor business operations - Metrics: counters, histograms, and gauges for business KPIs
- Logs: automatically correlated with traces via trace ID
- Vendor-neutral: export to Jaeger, Prometheus, Datadog, or any OTLP backend
- Enrich spans with user context, tenant IDs, and custom tags
- Sample in production: ParentBased + ratio sampling keeps traces complete
Frequently Asked Questions
What is OpenTelemetry in .NET?
OpenTelemetry is a vendor-neutral standard for collecting traces, metrics, and logs. In .NET it builds on Activity and System.Diagnostics.Metrics, so you instrument once and export to any backend like Jaeger, Prometheus, Grafana, or Azure Monitor over OTLP.
How do you add distributed tracing to an ASP.NET Core app?
Add the OpenTelemetry.Extensions.Hosting package, call AddOpenTelemetry().WithTracing, and enable the ASP.NET Core, HttpClient, and SQL instrumentation packages. Incoming requests, outgoing calls, and database queries are then traced automatically.
What is the difference between a trace and a span?
A trace covers one request from start to finish across the system. A span is a single timed operation within it, like an HTTP call or database query. Spans nest to form the trace tree. In .NET, a span is represented by the Activity class.
Do I need the OpenTelemetry Collector?
Not to get started; your app can export straight to a backend over OTLP. A collector becomes useful in production for buffering, sampling, redaction, and fanning out telemetry to multiple backends without changing application code.
Does OpenTelemetry tracing slow down my application?
The overhead is small for typical workloads, but not zero. In high-throughput services, use sampling (for example ParentBased with TraceIdRatioBased) to record a fraction of traces while keeping every trace complete end to end.


