
The agent and gateway pattern is a two-tier OpenTelemetry Collector deployment: a small agent collector on every box that receives OTLP from the local app, batches, and forwards, plus one central gateway collector that fans out to the backends (traces to Tempo, logs to Loki, metrics to Prometheus). Apps only know a local address; only the gateway knows where the backends are.
OpenTelemetry tutorials usually end with a single app exporting to a single collector and Grafana. I wrote one of those myself in monitoring .NET applications with OpenTelemetry and Grafana.
The setup changes once the system grows past one machine. Katabench runs its API and its grading workers on separate boxes, with the monitoring stack on a third, so you have to decide which process sends telemetry where.
The Topology
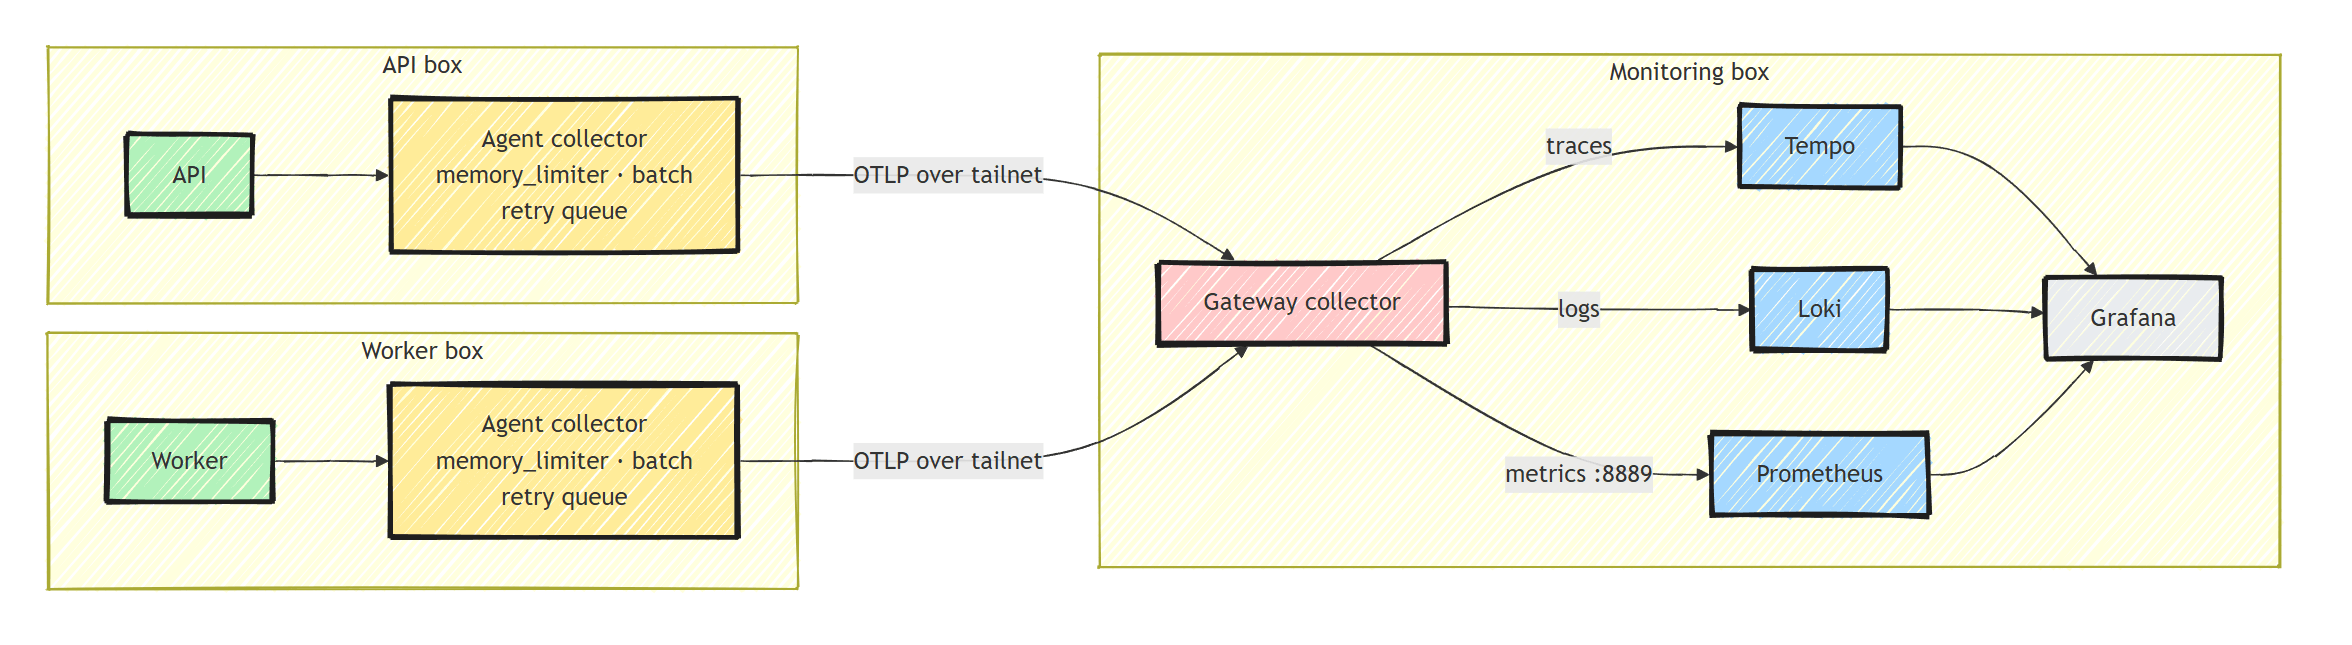
Each application box runs a small collector next to the app.
The app exports OTLP to http://otel-collector:4317, a name that resolves inside the box's own compose network, and knows nothing else.
The agents forward to the gateway on the monitoring box over a private Tailscale network. The gateway is the only component that knows the backends exist: traces go to Tempo, logs to Loki over its native OTLP ingest, and metrics are exposed on a scrape endpoint for Prometheus.
Adding a box to the system costs zero monitoring configuration.
Telemetry is push-based, service.instance.id distinguishes instances, and the new box's agent just needs the one gateway address.
Why Run an Agent on Every Box?
The agent config is short enough to show almost in full:
receivers:
  otlp:
    protocols:
      grpc:
        endpoint: 0.0.0.0:4317

processors:
  # Limits the collector's heap. Data above the limit is refused, not queued.
  memory_limiter:
    check_interval: 1s
    limit_mib: 96
    spike_limit_mib: 32
  batch:

exporters:
  otlp/gateway:
    endpoint: ${env:OTEL_ENDPOINT}   # no default: missing value fails at boot
    tls:
      insecure: true                 # the link is WireGuard-encrypted already
    retry_on_failure:
      enabled: true
    sending_queue:
      enabled: true
      queue_size: 5000

service:
  pipelines:
    traces:
      receivers: [otlp]
      processors: [memory_limiter, batch]
      exporters: [otlp/gateway]
    # metrics and logs: same shape
Those thirty lines contain four deliberate decisions:
- The app only knows a local address. No cross-box IP is baked into app config. When the monitoring stack moves, app deployments don't change.
- A sending queue plus retry rides out a gateway or network blip instead of dropping spans. Direct app-to-backend export only has the SDK's small in-memory batch queue, and the .NET SDK doesn't retry a failed export by default.
memory_limiterruns first in every pipeline, and the numbers matter on shared boxes. My worker box's RAM is budgeted for sandbox runs, so the agent gets a 96 MB heap limit and sheds load rather than competing with the actual workload for memory.${env:OTEL_ENDPOINT}has no default. A missing value crashes the collector at boot. The alternative is a collector that starts fine but exports nowhere, and you only notice when you need the data during an incident.
The agent also publishes no host ports. It is reachable only by the app container on the same compose network, so no application box exposes an OTLP ingest surface, not even on the private network.
The Gateway: One Ingest Point, Per-Signal Fan-Out
The gateway is where the per-signal routing happens:
exporters:
  prometheus:
    endpoint: 0.0.0.0:8889        # scrape surface for Prometheus
  otlphttp/loki:
    endpoint: http://loki:3100/otlp # Loki ingests OTLP natively since 3.0
  otlp/tempo:
    endpoint: tempo:4317

service:
  pipelines:
    traces:
      receivers: [otlp, faro]
      processors: [batch]
      exporters: [otlp/tempo]
    metrics:
      receivers: [otlp]
      processors: [batch]
      exporters: [prometheus]
    logs:
      receivers: [otlp, faro]
      processors: [batch]
      exporters: [otlphttp/loki]
That faro receiver is the bonus a central gateway buys you.
The browser SPA reports real-user monitoring (JS errors, Web Vitals, fetch spans) through Grafana Faro into the same collector, sharing the traces and logs pipelines.
A browser fetch and the API span it triggered land in one Tempo trace, stitched by the propagated traceparent.
It is the single observability endpoint that must be public, because it is called from users' browsers; everything else stays private.
Key Takeaways
Rules of thumb for when you need this, from running it:
- One box, one app: a single collector is fine. Don't build the two-tier setup for a monolith on one VPS.
- Two or more boxes, or any box whose RAM you care about: add agents. The local buffering alone pays for the extra container the first time your monitoring box restarts during a deploy and no telemetry is lost.
- Browser RUM, or multiple teams sending telemetry: you want the gateway as the single, controlled ingest point regardless of box count.
The .NET side of the wiring never changes: the OTLP exporter still points at whatever OTEL_EXPORTER_OTLP_ENDPOINT says, which is exactly how it worked back when the whole stack was one docker-compose file (the setup from introduction to distributed tracing with OpenTelemetry in .NET).
Only the address changed.
Frequently Asked Questions
What is the difference between an agent and a gateway OpenTelemetry Collector?
An agent runs on the same machine as the application and is a local hop: it receives OTLP from the local app, batches and compresses, and forwards everything to the gateway. The gateway is the central collector that owns the fan-out to the storage backends: traces to Tempo, logs to Loki, metrics exposed for Prometheus. Apps only know a local address; only the gateway knows where the backends are.
Why not export OTLP directly from the app to the backend?
Direct export couples every app instance to backend addresses and loses telemetry during a backend or network blip, because the SDK only batches into a small in-memory queue and does not retry failed exports by default. An agent collector absorbs those failures with a sending queue and retry, ships in compressed batches, and means the app config never changes when the monitoring stack moves.
What does the memory_limiter processor do?
It limits the collector's heap usage: it checks memory every check_interval and, once usage crosses the soft limit, refuses new telemetry instead of queueing it. It must be the first processor in every pipeline so it can shed load before batching allocates more memory. On a box whose RAM is budgeted for real workloads, it keeps the collector near a fixed memory budget, but it does not replace sizing the collector properly.
Does the OpenTelemetry Collector need TLS on a private network?
If the link between agent and gateway is already encrypted at a lower layer, for example a WireGuard-based private network like Tailscale, plaintext OTLP with tls.insecure is a reasonable choice. The traffic is encrypted on the wire by WireGuard, and you skip managing certificates for an internal hop.


